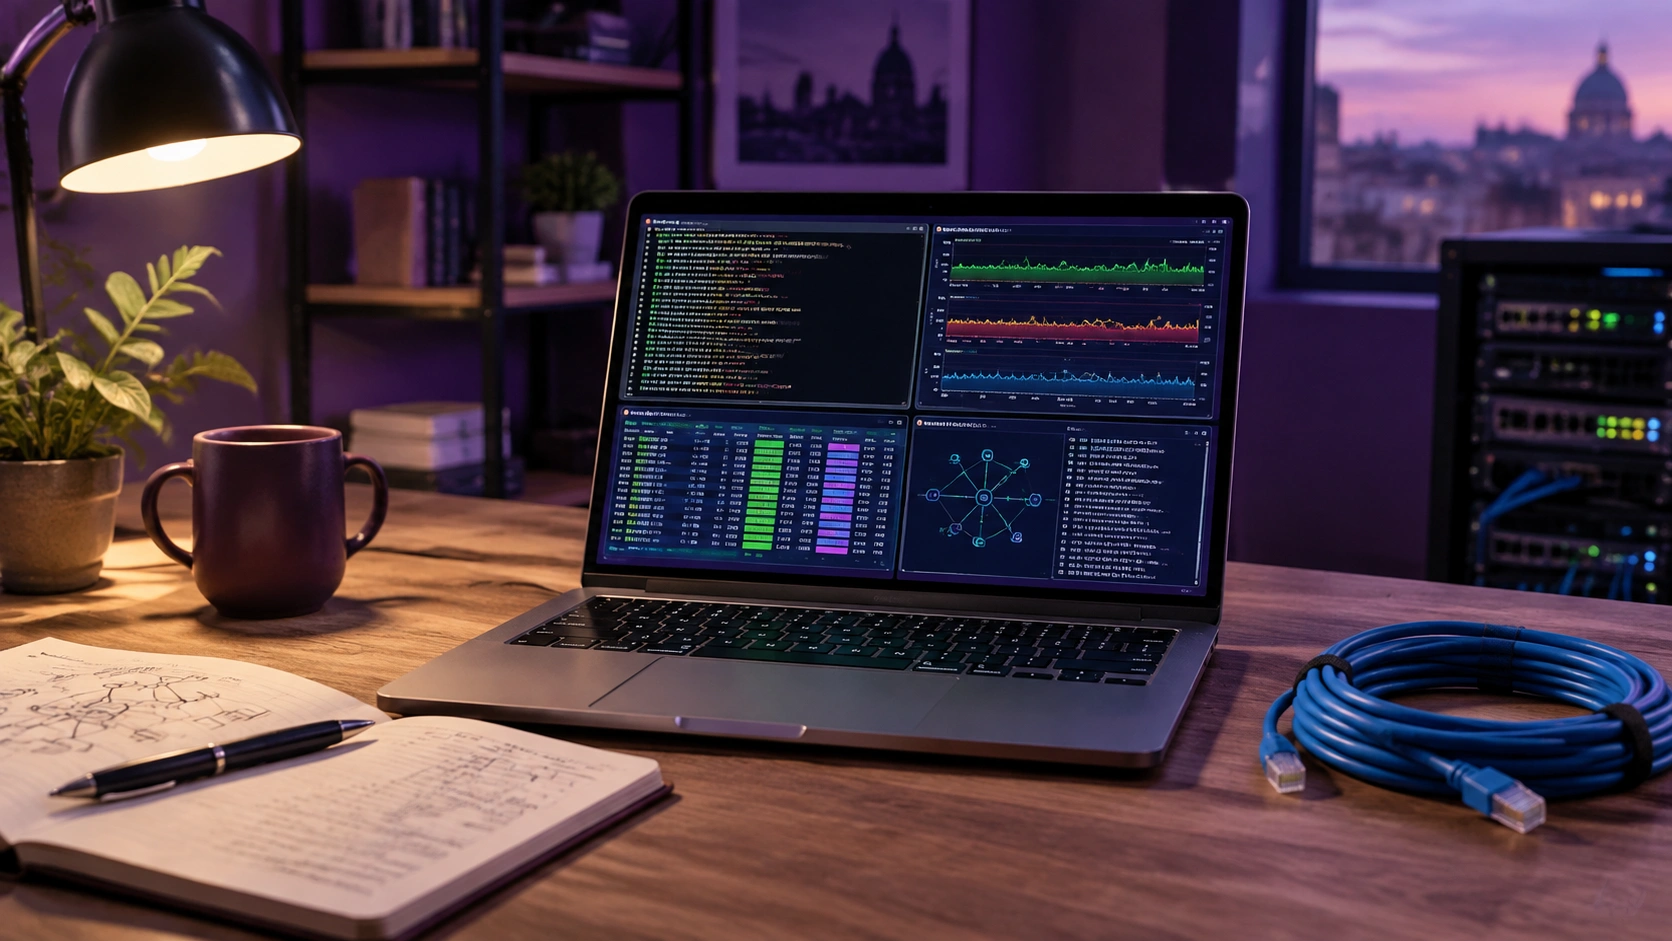
Good observability does not require a huge platform on day one. Start with tools that show what is happening now without overwhelming a small team. htop gives a quick view of CPU, memory, and per-process load. iftop or nethog reveals which connections are consuming bandwidth. For disk pressure, iostat highlights wait time that top-level CPU graphs often miss. A simple latency probe with curl and timestamps can expose slow endpoints before users complain. Finally, a lightweight trace viewer such as Jaeger helps follow one request across services when numbers alone are confusing. The key is to pair each tool with a clear question: Is the host busy, is the network full, is storage waiting, or is one path slow? Which tool has saved you during a tough incident, and what did it show that dashboards did not?